Class width is the size of the numeric range each bar or row in a frequency table covers. How to calculate class width: subtract the minimum from the maximum, divide by the number of classes, then round up. Twelve exam scores from 62 to 99, split into 5 classes, give a class width of 8 — the raw division comes out to 7.4, and 7.4 always rounds up, never down.
how to calculate class width
Class Width in Statistics: How to Calculate It, Round It and Read It From a Histogram
On this page
- What class width is
- How to calculate class width: the formula
- How to determine the number of classes
- Class width with decimals: always round up
- Class width of a histogram
- When class width is not uniform
- Class width vs class boundaries vs class limits
- Practice: five data sets
- When the frequency-table assignment is due
What class width is
Every class in a frequency table or histogram is supposed to cover the same width unless the data specifically calls for otherwise — how wide a slice of the data each bar represents, in the same units the data itself is measured in. Comparing bar heights across a histogram only means something when every bar covers equal ground; a class twice as wide as its neighbor draws a bar with twice the area for the same count, and it collects more values just from covering more of the range. This page builds the frequency table and its classes; the rest of the statistics-basics toolkit, from z-scores to populations and unusual values, is on the z table and other statistics basics.
How to calculate class width: the formula
The formula: (max - min) / number of classes, rounded up
Class width statistics questions all use one formula:
A worked example from a raw data set
Twelve exam scores: 62, 65, 70, 71, 74, 78, 81, 85, 88, 91, 95, 99. Range: . With 5 classes, the raw width is , rounded up to 8.
| Class | Frequency |
|---|---|
| 62–69 | 2 |
| 70–77 | 3 |
| 78–85 | 3 |
| 86–93 | 2 |
| 94–101 | 2 |
How to determine the number of classes
How to determine class width starts one step earlier than the formula above: picking how many classes to use in the first place, since the formula needs that number before it can run. How to determine class width in statistics, when an assignment doesn't hand you the number of classes directly, means picking one of the two rules below rather than guessing.
Sturges' rule, worked
Sturges' rule is
The square-root rule, worked
The square-root rule is simpler: . For the same : , rounded to 7 classes — close to Sturges' rule here, though the two rules can disagree on other data sets, since they're two different approximations, not two paths to one guaranteed answer. Either is an acceptable starting point unless an assignment specifies which one to use; both exist only to keep the number of classes reasonable, neither too few to show a shape nor so many that classes sit empty.
Class width with decimals: always round up
Rounding down would leave the highest data point, 99, outside every class. How do you find the class width in statistics when the division doesn't come out even? Always round up: a class width of 7 (rounded down from 7.4) only reaches 62+7×5=97, one class boundary short of covering 99.
An exact division needs the same care. With whole-number data, a width that divides the range exactly ends the last class one unit below the maximum, so go up to the next whole number: 10 to 94 in 6 classes gives , but six classes of 14 stop at 93, so use 15 (practice item 1 below).
A data set with decimals
Suppose rainfall totals are recorded to one decimal place, from 1.2 to 8.9 inches, split into 6 classes. The range is and , so round up at the data's own precision to a class width of 1.3. The classes run 1.2–2.4, 2.5–3.7, 3.8–5.0, 5.1–6.3, 6.4–7.6 and 7.7–8.9, and the last one ends exactly at the maximum. The boundaries sit halfway between classes (1.15, 2.45, 3.75 and so on), still 1.3 apart.
Class width of a histogram
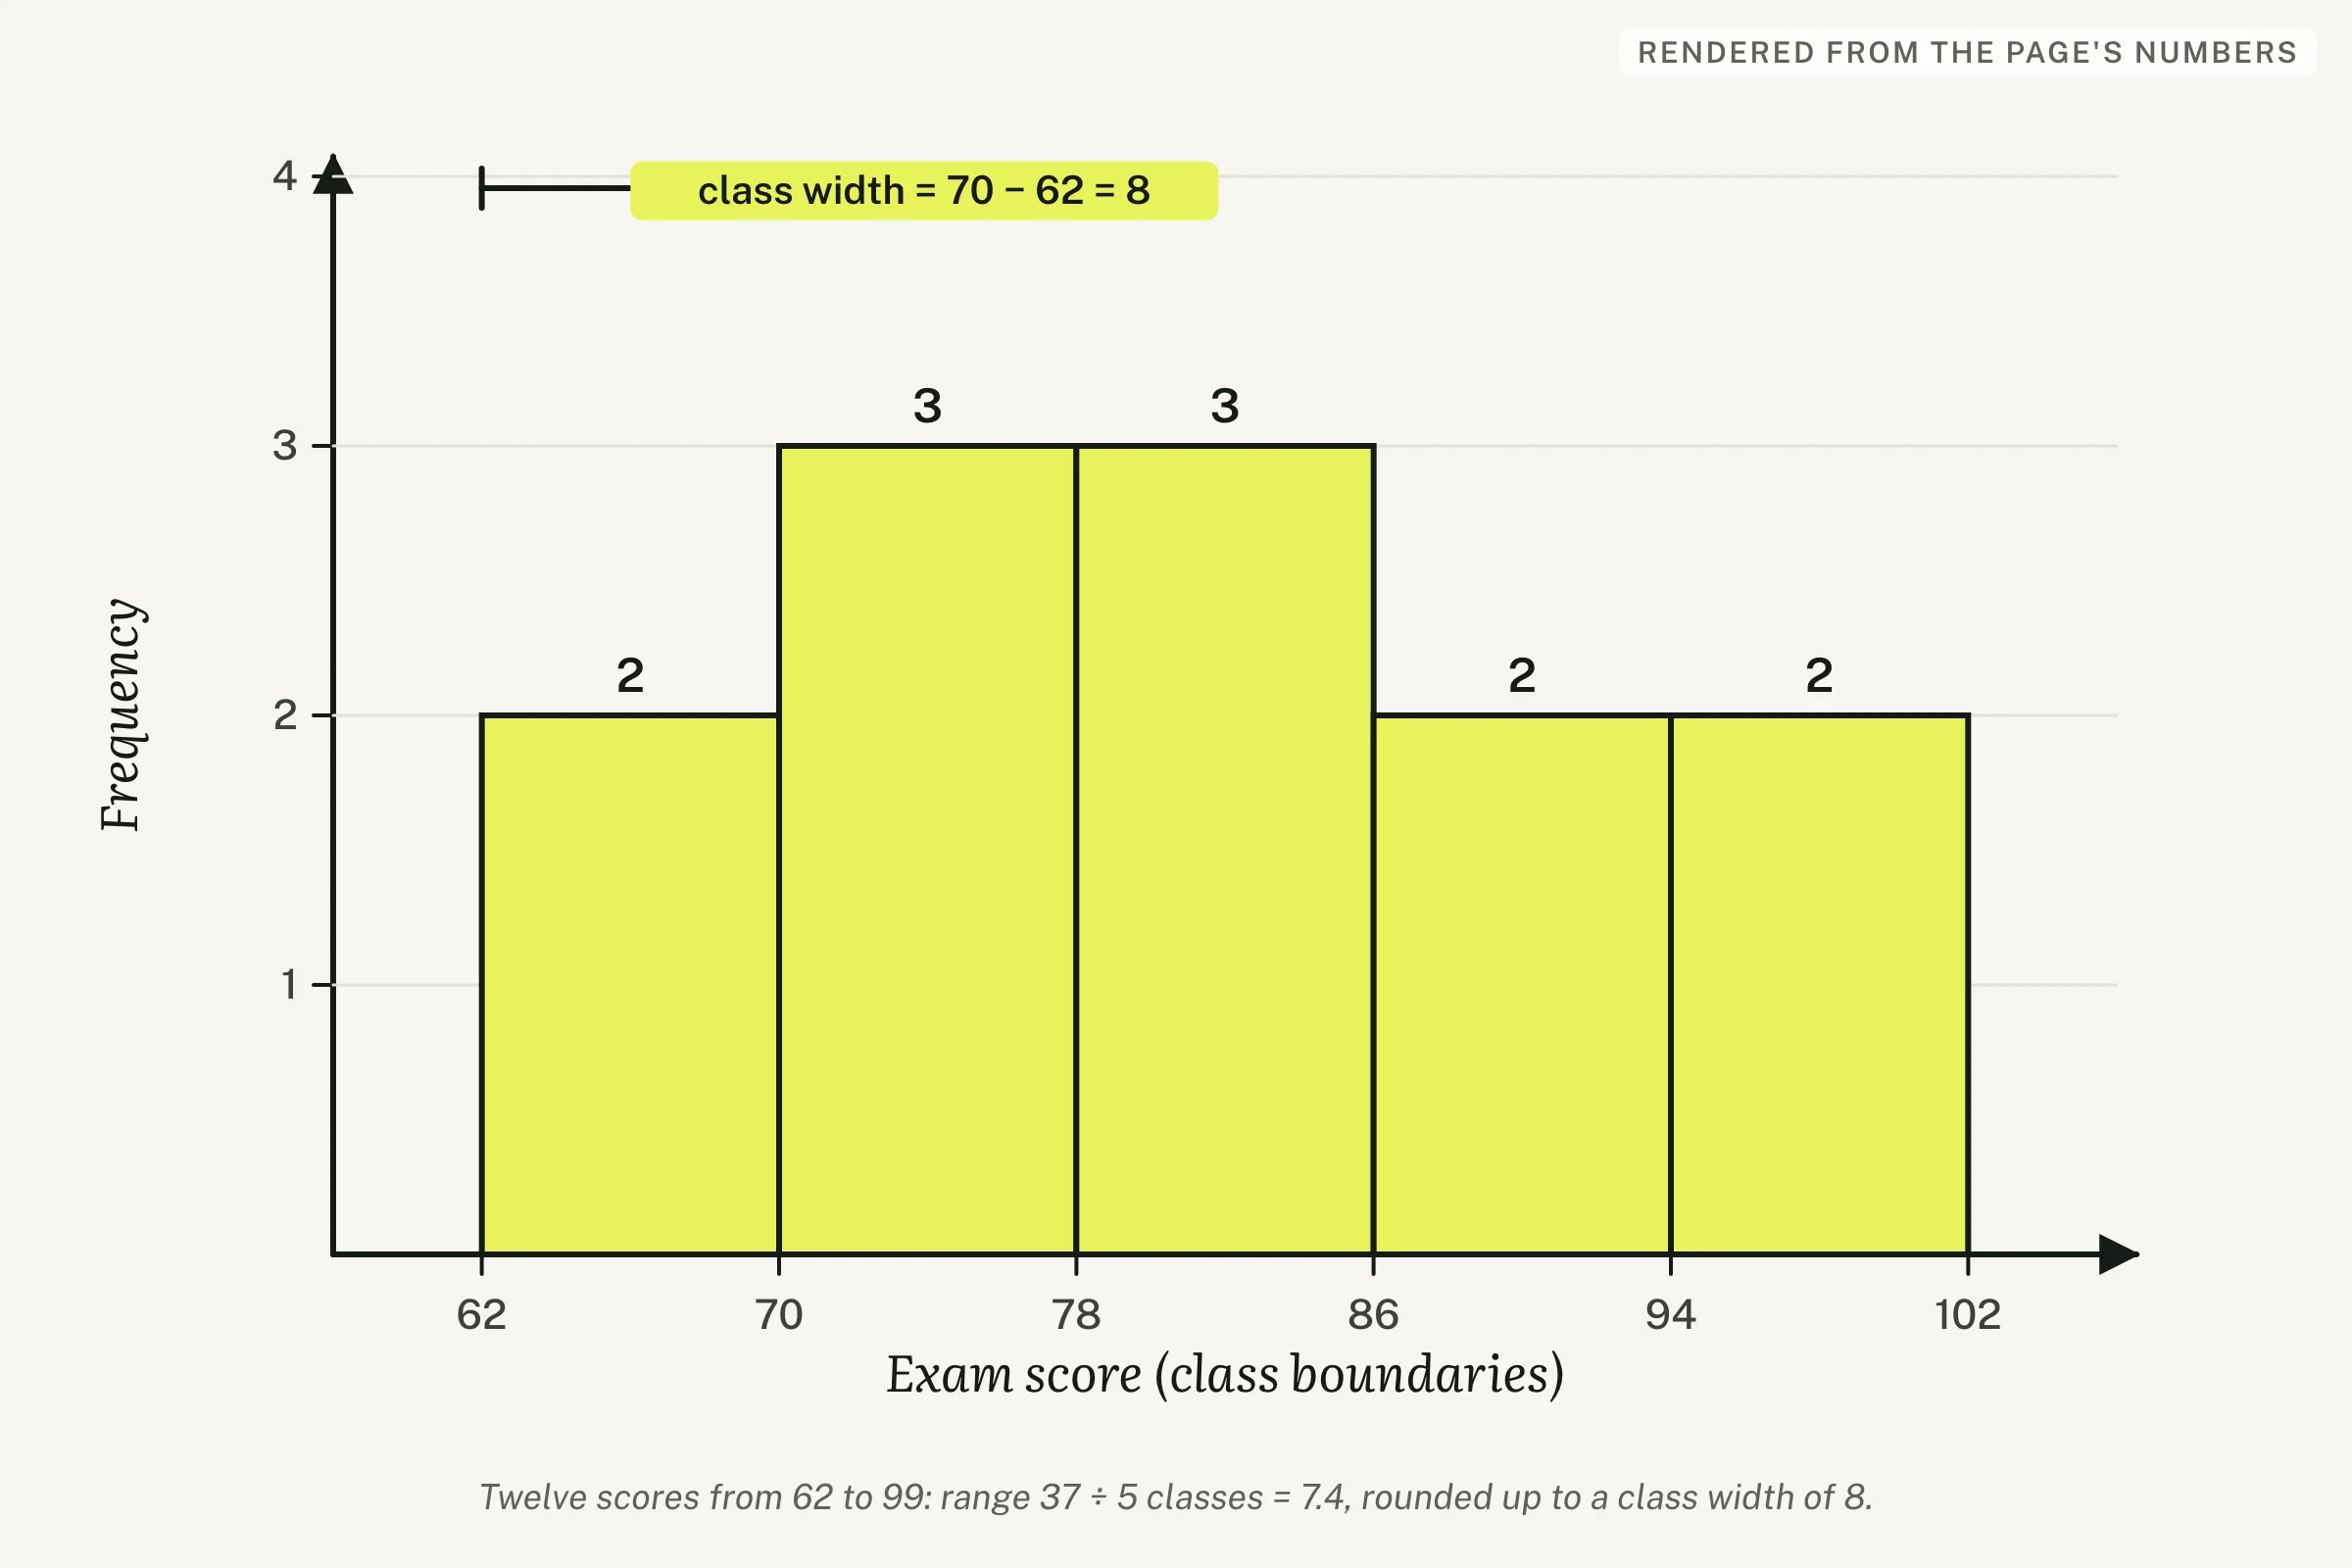
A class width histogram makes the formula visible: instead of subtracting and dividing, just read two neighboring labels off the x-axis and subtract one from the other. This figure marks each bar at its lower class limit, although its axis title calls those marks class boundaries; under the ±0.5 convention in the table below, the true boundaries are 61.5, 69.5, 77.5 and so on. Either way, the marks are 8 apart. Every gap between consecutive marks on a correctly drawn class width histogram is identical, so uneven gaps flag a mistake in the histogram or in its table. This is also the fastest way to answer how to calculate the class width when you're handed a finished histogram instead of a raw data set: skip the formula entirely and read the axis.
When class width is not uniform
Not every frequency table uses one width throughout. Household income brackets are a common example: $0–$24,999 and $25,000–$49,999 (width 25,000 each), then $50,000–$99,999 (width 50,000), then an open-ended $100,000+ class. Unequal widths group the data more evenly when most values cluster at one end and thin out at the other, so heavy skew is the usual reason class width is not uniform, though many skewed data sets are still tabulated with equal widths.
Class width vs class boundaries vs class limits
The three terms describe the same frequency table from three different angles, and mixing them up is a common source of wrong answers on an otherwise correct calculation.
| Term | What it means | Value for "70–77" |
|---|---|---|
| Class limits | The smallest and largest data values the class actually contains | 70 and 77 |
| Class boundaries | The true dividing points between classes, usually limit ± 0.5 | 69.5 and 77.5 |
| Class width | The distance between consecutive boundaries (or consecutive lower limits) |
Class limits come straight from the data and can never overlap between classes; class boundaries exist specifically to remove the gap between one class's limit and the next class's limit, which is what makes subtracting them give a clean class width. Without that half-unit adjustment, subtracting one class's lower limit from the next class's lower limit still works for whole-number data — matches the width found earlier — but boundaries are the version that generalizes to decimal data too, where limits alone would leave a gap between classes.
Practice: five data sets
- Min 10, max 94, 6 classes — range , exactly, but six classes of 14 starting at 10 end at 93 and miss 94, so go up to the next whole number. Class width: 15.
- Min 5, max 100, 8 classes — range , . Class width: 12 (rounded up).
- Min 0, max 49, 5 classes — range , . Class width: 10 (rounded up).
- Min 120, max 245, 7 classes — range ,
- Min 1, max 60, 10 classes — range , . Class width: 6 (rounded up).
Once a frequency table like the ones above has counts instead of probabilities in its right-hand column, turning a frequency table into a probability distribution is the next step — divide each count by the total and the two checks on that page take over from here.
When the frequency-table assignment is due
A single class width takes a minute with the formula above; a full frequency-distribution assignment with several data sets rarely does, so most students turn to homework help by subject for the rest of it, and GradeDraft's statistics desk handles the whole statistics assignment, worked start to finish.
Send the assignment or data set. You'll get a quote within 2 hours (8 am–11 pm ET) and worked steps with the delivery.
Get my statistics assignment workedFAQ
Class width questions
Replies within 2 hours, 8 am–11 pm ET, 7 days a week
01How do you find class width on a histogram?
Read the x-axis labels and subtract two adjacent ones — the gap between consecutive labels is the class width, whether the axis marks lower class limits or class boundaries. On the histogram above, the marks are the lower class limits 62, 70, 78, 86 and 94, plus 102 closing the last bar, each 8 units apart, matching the formula's answer.
02What is the difference between class width and class boundaries?
Class width is a single number — the size of each class. Class boundaries are the two endpoints that define where one class starts and the next begins. Subtracting one lower boundary from the next lower boundary gives the class width. For the class 70–77, the boundaries are 69.5 and 77.5, 8 apart.
03Do you round class width up or down?
Always up. Rounding down shrinks the total span the classes cover, which can leave your largest data value with no class to belong to. When the division comes out exact, go up anyway: with whole-number data, a width that divides the range exactly ends the last class one unit below the maximum, so becomes a width of 15, as in practice item 1.
04What is class width in statistics?
Class width in statistics is the size of the numeric range each bar or row in a frequency table covers, found by dividing the data's range by the number of classes and rounding up. A class width of 8, for example, means every class in that table spans 8 units, from one boundary to the next — the 62–69 class and the 70–77 class in the worked example above are two such classes, each 8 units wide.